 According to the experts, the state of the South African property market at the beginning of 2013 is slightly rosier, but remains overcast.
While the sector is recovering from the sad stagnation of 2008, there are simply not all that many buyers, not even with the interest rates at all-time low. This is because a large number of would be buyers are still are able to persuade the banks to give them a housing loan (of course, even smaller number have access to anything like ready cash).
As a consequence, there’s still an oversupply of property. So, if you are among the lucky few who can get cash or credit, you may be able to find bargains and (perhaps) realise a significant profit over a longer term.
Property-wise, 2013 and several years to come will see the buyers in the stronger position. What are the sellers to do? If sell they must, they better come outright with realistic pricing, and have the property spic-spank. Rarely anyone wants to part with the money and have to do the renovations as well!
And how does the bidorbuy property sector fare?
Truth to be told, we cannot tell you. The great majority of houses or flats offered on bidorbuy for sale are listed in the classified format, which means that the transactions are concluded off the site. So, alas, we have no ways to track them…
We can only tell you that, yes, buyers should definitely check the offer in the bidorbuy property section, because so many properties are listed there: more than 140,000. And yes, sellers should definitely list their property on bidorbuy, because so many prospective buyers visit our site: more than 1.5 million per month.
To the parties who enter into negotiations as a result of their encounter in the bidorbuy property section, we wish a mutually beneficial conclusion of the deal!
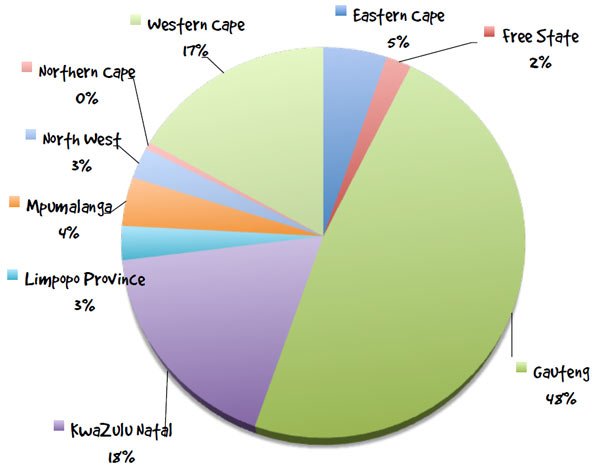
In case you wondered which provinces attract the most interest from prospective property buyers on bidorbuy, Gauteng leads (as is to be expected), and Kwa Zulu Natal is (perhaps surprisingly) currently a little ahead of Western Cape. Here is the property attraction graph in percentages per province:


